Power BI is a robust business intelligence and data visualization tool that empowers individuals and organizations to make data-driven decisions. Its intuitive interface, powerful analytics capabilities, and seamless integration with various data sources make it a popular choice for professionals in diverse industries. Whether you’re a beginner eager to explore data visualization or an experienced analyst looking to expand your skill set, Power BI projects offer the perfect opportunity to build practical knowledge and create meaningful insights.
This list of 10 impressive Power BI project ideas is designed to inspire and challenge you, regardless of your proficiency level. Each project is tailored to address real-world scenarios, ranging from tracking sales performance in e-commerce to analyzing customer segmentation, monitoring stock market trends, and even visualizing environmental impact data. For each idea, you’ll find details on complexity, required tools, learning objectives, and access to source code. These projects are not only a great way to strengthen your technical skills but also to showcase your expertise in building impactful dashboards and analytics solutions. Dive in and take your Power BI journey to the next level!
What Is Power BI ?
Power BI is a business analytics and data visualization tool developed by Microsoft. It enables users to connect to a wide range of data sources, transform raw data into meaningful insights, and create interactive dashboards and reports. Power BI is widely used across industries for making data-driven decisions, as it helps users visualize complex datasets through dynamic charts, graphs, and tables. It integrates seamlessly with other Microsoft tools like Excel, Azure, and SharePoint, as well as third-party applications and databases.
Key features of Power BI include:
- Data Integration: Connects to multiple data sources such as databases, APIs, cloud services, and flat files.
- Data Transformation: Provides tools like Power Query for cleaning, transforming, and modeling data efficiently.
- Visualizations: Offers a rich library of visualizations, including bar charts, maps, and custom visuals for storytelling with data.
- DAX (Data Analysis Expressions): A formula language that helps perform complex calculations and create custom measures.
- Collaboration: Allows sharing dashboards and reports with teams or publishing them to the web or Power BI Service.
- Python Internship In Chennai
- Machine Learning Course In Chennai
- Data Analytics Course In Chennai
- SQL Internship In Chennai
- Full Stack Development Course In Chennai
- Front End Development Course In Chennai
- Internships In Chennai
- Internship For CSE Students In Chennai
- Internship For IT Students In Chennai
- Top 50 Mini Project Ideas For College Students
- 15 Unique Web Development Project Ideas For Beginners
Power BI is available in different versions, such as Power BI Desktop (a free, standalone application), Power BI Pro (a subscription-based version for sharing and collaboration), and Power BI Premium (offering advanced features like AI, big data support, and paginated reports). Its user-friendly interface and powerful features make it suitable for beginners and professionals alike, catering to small businesses as well as large enterprises.
1.Airline Performance Dashboard
Description: Build an interactive dashboard to monitor airline performance metrics like flight delays, cancellations, on-time performance, and passenger satisfaction. This dashboard can also include revenue and operational cost analysis.
- Time Taken: 2-3 weeks
- Project Complexity: Advanced
- Technology Stack: Power BI, SQL, Python (for data processing)
- Learning Curve and Required Skills: Advanced DAX, Power Query, and real-time API integration
- Integration with Other Systems: Airline booking systems and operational databases
- Security Measures: Role-based access to airline stakeholders and encryption for sensitive data
Source Code: Airline Metrics Dashboard
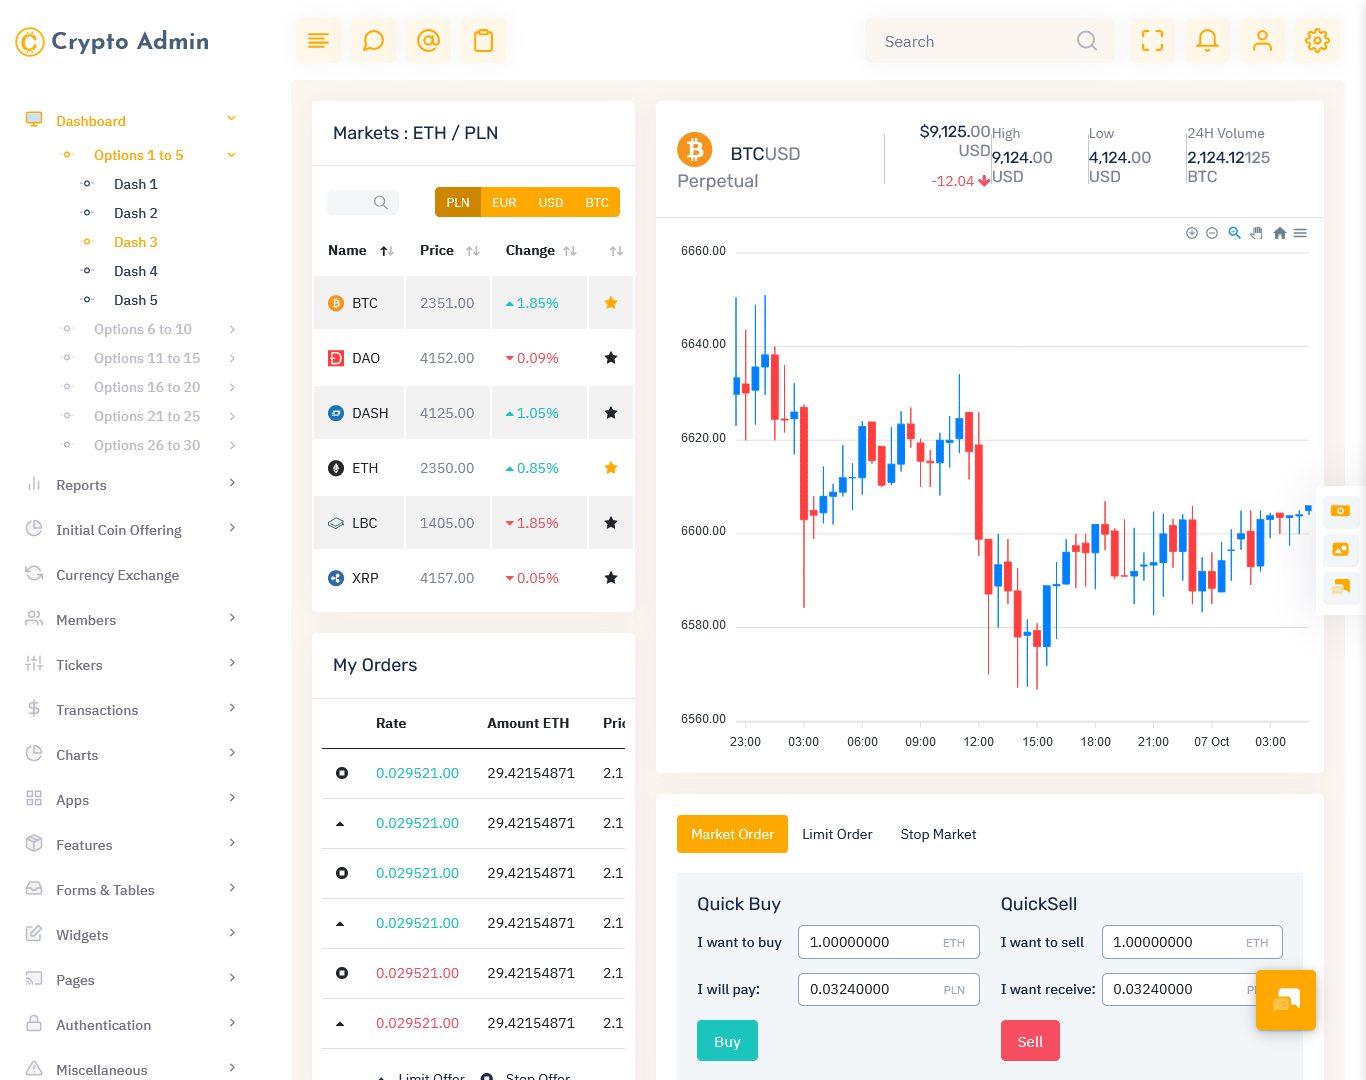
2. Cryptocurrency Performance Dashboard
Description: Create a dashboard that tracks cryptocurrency prices, trading volumes, and market caps. Include real-time charts for price fluctuations and historical trend analysis.
- Time Taken: 2-3 weeks
- Project Complexity: Advanced
- Technology Stack: Power BI, Crypto APIs (e.g., CoinGecko, CoinMarketCap), Python
- Learning Curve and Required Skills: API integration, DAX, and Power BI visuals
- Integration with Other Systems: Supports direct integration with crypto trading platforms
- Security Measures: API key encryption and user-level access control
Source Code: Crypto Market Dashboard

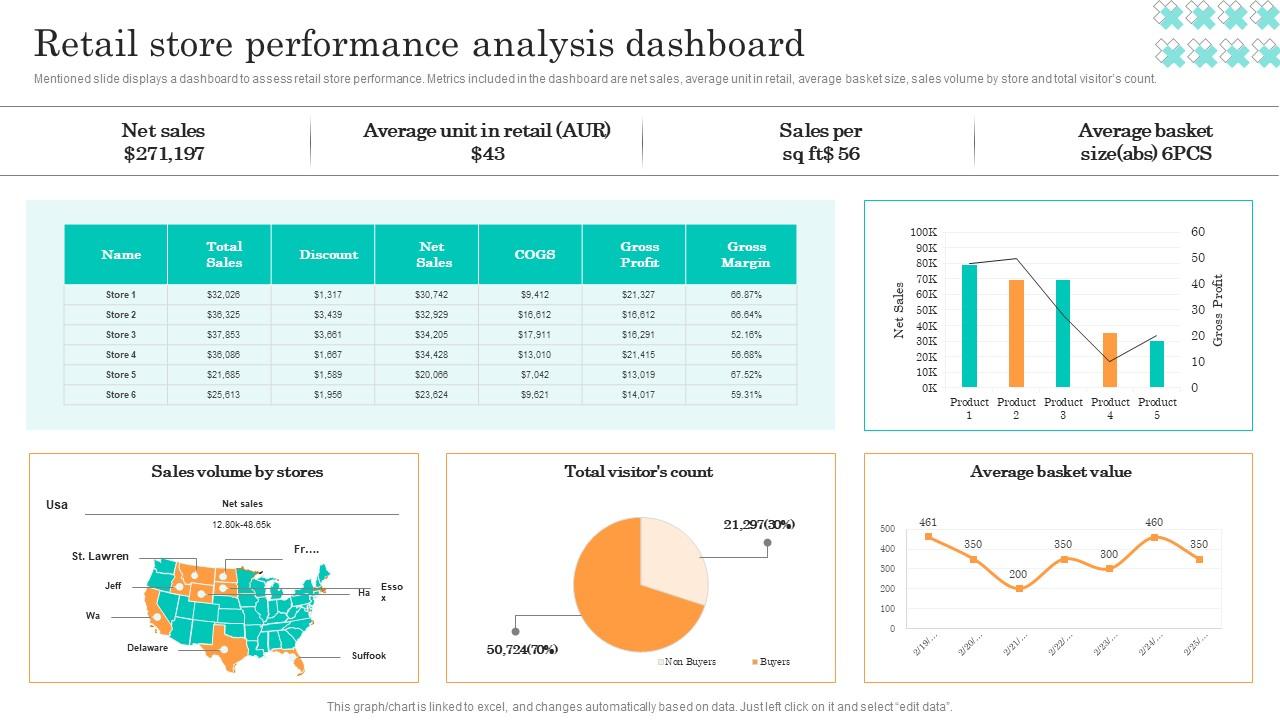
3. Retail Store Analysis
Description: Analyze sales performance, inventory levels, and customer footfall data for retail outlets. The dashboard will highlight peak hours and identify underperforming stores.
- Time Taken: 1-2 weeks
- Project Complexity: Intermediate
- Technology Stack: Power BI, SQL, Excel
- Learning Curve and Required Skills: Data cleaning with Power Query, DAX
- Integration with Other Systems: Compatible with POS and inventory management systems
- Security Measures: Role-based access for store managers
Source Code: Retail Analysis Dashboard

4. Population Demographics Dashboard
Description: Analyze population data by region, age group, and gender distribution. Visualize trends like population growth and migration patterns.
- Time Taken: 1-2 weeks
- Project Complexity: Beginner
- Technology Stack: Power BI, Census API, Excel
- Learning Curve and Required Skills: Basic API usage, Power BI visualization skills
- Integration with Other Systems: Government data portals
- Security Measures: No sensitive data; public sharing
Source Code: Demographics Dashboard

5. Social Media Engagement Tracker
Description: Develop a dashboard to analyze social media engagement metrics such as likes, shares, and comments. Compare the performance of campaigns across platforms like Facebook, Twitter, and Instagram.
- Time Taken: 1-2 weeks
- Project Complexity: Intermediate
- Technology Stack: Power BI, APIs (Facebook Graph API, Twitter API), Excel
- Learning Curve and Required Skills: API integration, DAX, and Power BI visualization
- Integration with Other Systems: Seamless API integration for real-time data updates
- Security Measures: Secure API keys and restrict dashboard access via Power BI authentication
Source Code: Social Media Insights Dashboard
![]()
6. Budget vs. Actual Dashboard
Description: Develop a dashboard that compares planned budgets against actual expenses across various departments. Highlight budget deviations and visualize spending trends over time.
- Time Taken: 1-2 weeks
- Project Complexity: Intermediate
- Technology Stack: Power BI, Excel, SQL
- Learning Curve and Required Skills: Data modeling, DAX for calculations, and Power Query for ETL
- Integration with Other Systems: Integrates seamlessly with accounting software like QuickBooks or ERP systems
- Security Measures: Restrict access to financial stakeholders and apply row-level security
Source Code: Budget Analysis Dashboard

7. Event Management Dashboard
Description: Build a dashboard to monitor ticket sales, attendee demographics, and feedback for events. Track profitability and visualize trends for effective event planning.
- Time Taken: 2-3 weeks
- Project Complexity: Intermediate
- Technology Stack: Power BI, SQL, Event Management APIs
- Learning Curve and Required Skills: DAX, Power Query, and API integration
- Integration with Other Systems: Integrates with event management software like Eventbrite
- Security Measures: Secure sensitive attendee data and apply user-level access restrictions
Source Code: Event Insights Dashboard

8. Weather Data Dashboard
Description: Build a dashboard to track weather data such as temperature, rainfall, and wind speed trends. Visualize patterns using geospatial maps and compare different locations.
- Time Taken: 1-2 weeks
- Project Complexity: Beginner
- Technology Stack: Power BI, Weather APIs, Excel
- Learning Curve and Required Skills: Basic API integration, DAX for trend analysis, and Power Query
- Integration with Other Systems: Supports real-time weather APIs
- Security Measures: Publicly accessible; no sensitive data involved
Source Code: Weather Trends Dashboard
9. Education Performance Dashboard
Description: Develop a dashboard to analyze student performance across subjects, grades, and schools. Include dropout rates, attendance patterns, and teacher performance metrics.
- Time Taken: 2-3 weeks
- Project Complexity: Intermediate
- Technology Stack: Power BI, SQL, Excel
- Learning Curve and Required Skills: DAX for performance KPIs, Power Query for data preparation
- Integration with Other Systems: School management systems and education databases
- Security Measures: Role-based security for teachers and school administrators
Source Code: Student Performance Dashboard

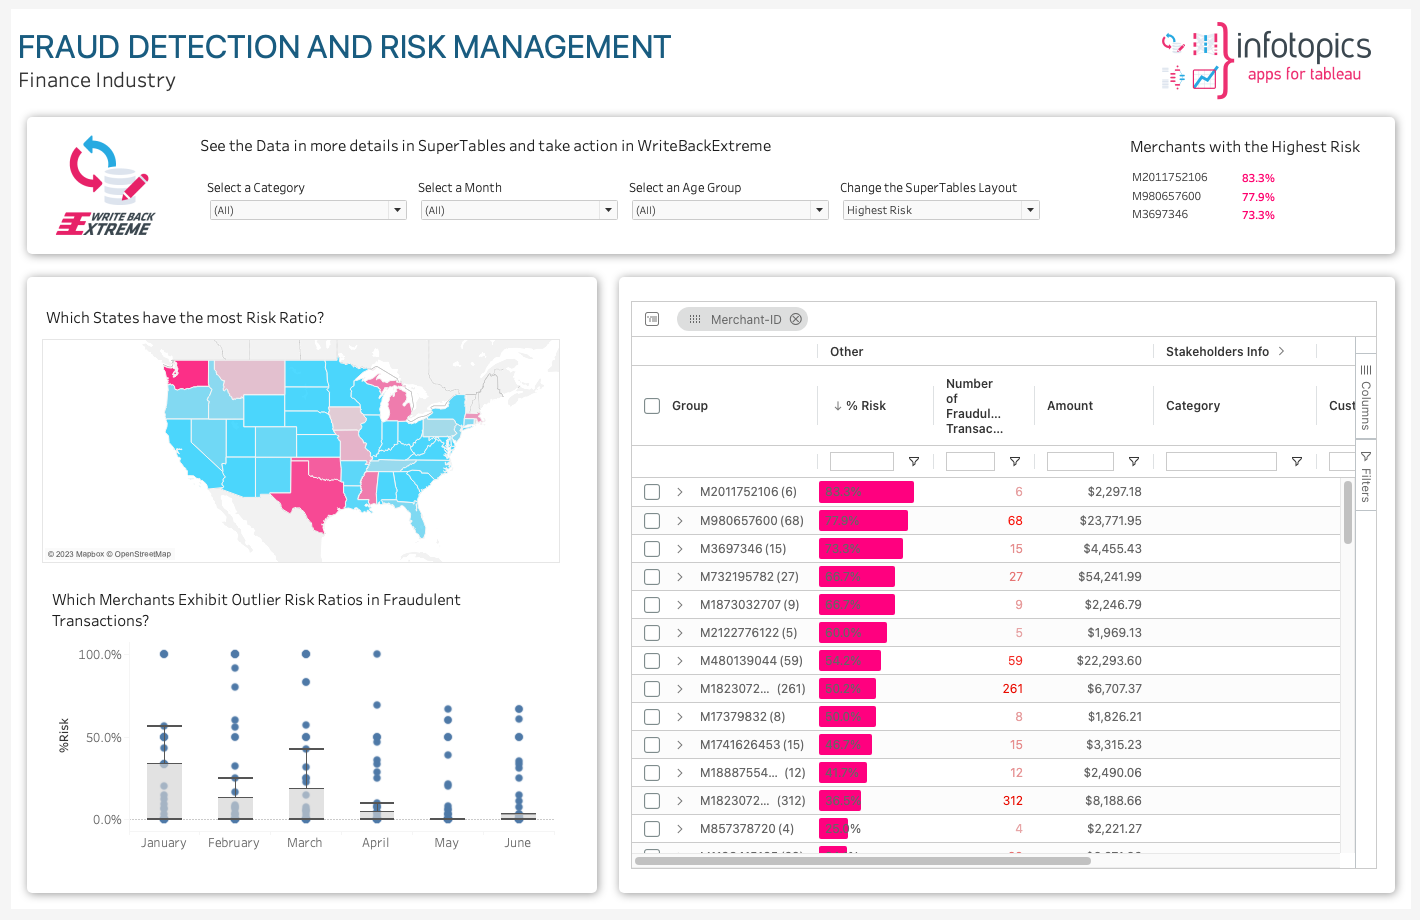
10. Fraud Detection Dashboard
Description: Build a dashboard to detect fraudulent transactions by analyzing anomalies in financial or customer data. Include heatmaps and trend graphs for detailed insights.
- Time Taken: 2-3 weeks
- Project Complexity: Advanced
- Technology Stack: Power BI, Python (for ML), SQL
- Learning Curve and Required Skills: Anomaly detection, DAX, Power Query
- Integration with Other Systems: Financial and transactional databases
- Security Measures: High security with encryption and role-based access
Source Code: Fraud Detection Dashboard

Conclusion
Power BI is a powerful tool that enables businesses and individuals to transform raw data into insightful dashboards and reports. The 10 project ideas shared above are perfect for honing your skills, whether you’re a beginner or an advanced user. By working on these projects, you’ll not only learn how to handle real-world data but also develop the ability to visualize it effectively, creating impactful data-driven solutions.
Each project idea provides an opportunity to explore unique aspects of Power BI, such as data modeling, DAX calculations, and interactive visualizations. Furthermore, the inclusion of source code ensures you can follow along or customize your work according to your needs.
So, pick a project, dive into the data, and let Power BI help you uncover valuable insights. Happy visualizing!


